
April 07-11 2025 Edition
Air Cargo Key Trends, Q1 2025
- Air Cargo Tonnages (Global): +3% Year-on-Year (YoY)
- Average Global Rates: +4% Year-on-Year (YoY)
Comparison to Previous Period (2024):
- 2024 Average Tonnage Growth (YoY): +11%
- Q4 2024 Tonnage Growth (YoY): +8%
Factors Influencing Current Market:
- Uncertain market conditions
- Anticipated disruptive new wave of U.S. tariffs especially with China (125%)
- Removal of U.S. de minimis exemptions for shipments from China and Hong Kong
- Challenges to some long-standing supply chain models
March 2025 Performance (Month-on-Month – MoM):
- Worldwide Tonnages (MoM): +19% (March vs. February)
- Note: February figures were lower due to seasonal factory closures after Lunar New Year.
March 2025 Performance (Year-on-Year – YoY):
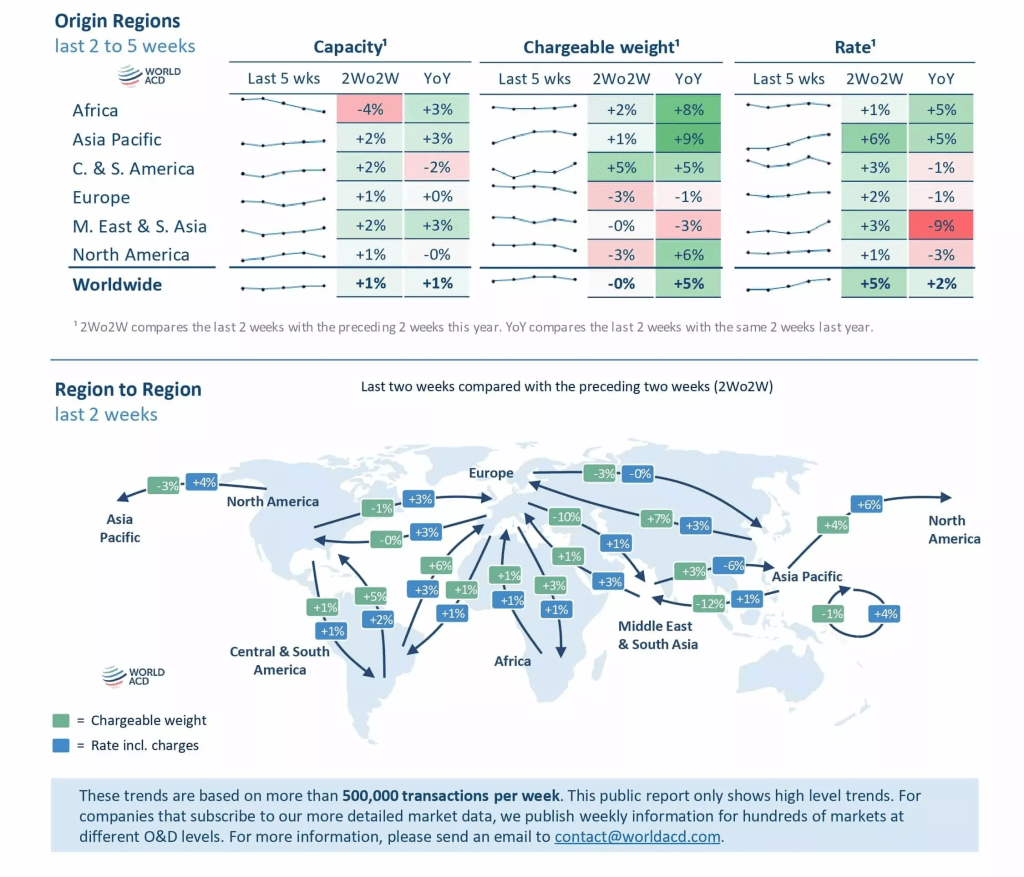
- Worldwide Tonnages (YoY): +5%
- Tonnage Growth by Region (YoY):
- Asia Pacific: +9%
- North America: +6%
- Middle East & South Asia (MESA): -6%
- Average Worldwide Rates (March): $2.38 per kilo
- Rate Change (MoM): +4%
- Rate Change (YoY): +2%
Week 13 2025 (March 24-30) – Spot Prices (Asia Pacific Origins):
- Spot Price: $3.80 per kilo
- Spot Price Change (Week-on-Week – WoW): +3%
- Tonnage Change (WoW): -3%
Shifting Trends in Global Shipping Rates
China-NA Rates Up (HKG +2.9% WoW, +3.6% YoY; SHG +2.5% WoW, +5.4% YoY): Despite some BSA cancellations, rates on busiest China-US lanes are rising. Reason: Potential volcanic disruption in Anchorage & sustained demand.
Intra-Asia (ex-China) Rates Softer: Vietnam & India routes saw slight decreases. Reason: Possible demand shift towards primary China lanes or regional economic variations.
Europe Outbound Rates Falling (FRA -14.1% WoW, still +7.3% YoY; LON -12.2% WoW, -11.2% YoY): Rates down to China, Japan, & US. Reason: Easing demand for European exports & potential market correction after prior gains.
Americas Outbound Rates Rebounding (CHI +11.1% WoW, +12.4% YoY): Rates rising again to China, Europe, & South America after recent drops. Reason: Potential strengthening demand for American exports.
Key Trend: Divergent rate movements across trade lanes. China-NA strong, Europe weakening, Americas recovering, other Asia softer. Driving Factors: Demand shifts, potential short-term disruptions (Alaska volcano), and market corrections are influencing these changes.
Viet Nam / USA Trade: Signs of Goodwill
Key Context:
- U.S. initiated 90-day “tariff pause,” impacting Vietnam.
- This pause gives Vietnam time to adjust to trade shifts.
Vietnam’s Response:
- Increased U.S. Imports:
- Buying Boeing aircraft.
- Boosting agricultural imports (soybeans, corn, pork, wheat).
- Expanding LNG imports.
- Considering Tariff Cuts:
- For U.S. energy, tech, medical, and pharma goods.
- Stronger Origin Control:
- Tighter rules to prevent trade fraud.
- Focus on key exports: wood, seafood, textiles, electronics.
- Developing Industries:
- Attracting investment to reduce import reliance.
- Priority sectors: yarn/fabric, microchips.
Trends & Implications:
- Trade Volatility: Tariffs create uncertainty, requiring agile responses.
- Vietnam’s Strategy:
- Balancing U.S. relations.
- Diversifying its economy.
- Enhancing production.
- Supply Chain Changes: Vietnam aims to be less reliant on imported materials.
- U.S. Importance: U.S. is a major market for Vietnam (e.g., textiles, wood).
- 2024 Trade Data (USTR):
- Total U.S.-Vietnam goods trade: $149.6 billion.
- U.S. exports to Vietnam: $13.1 billion (up 32.9% from 2023).
- U.S. imports from Vietnam: $136.6 billion (up 19.3% from 2023).
- U.S. goods trade deficit with Vietnam: $123.5 billion.
- Key Vietnam Exports to U.S.:
- Computers and electronics
- Textiles and apparel
- Footwear
- Key U.S. Exports to Vietnam:
- Machinery
- Agricultural products
- Aircraft
Retail Optimism vs. Tariff Realities & Shipping Disruptions
Retail Outlook 2025 (NRF):
- Sales Growth: +2.7% to 3.7% YoY (Total: $5.42T–$5.48T).
- Online Sales: +7%–9% YoY ($1.57T–$1.6T).
- Key Factors: Low unemployment, wage gains, solid finances.
- Tariff Impact: Retailers don’t expect tariffs to significantly hurt spending or cause recession.
- GDP Growth: Expected to slow to under 2%.
- Inflation: Tariff-related inflation may keep PCE around 2.5%.
- Risks: Policy uncertainty, lower consumer confidence, tariff anxiety.
- Credit: Delinquencies slightly up but normal if jobs stay strong.
USA/India Tariffs:
- India Export Surge: Bookings to US East Coast (USEC) up due to new 26% US tariff (effective April 9 – NOW PAUSED)
- Rate Hikes: Carriers pushing through April increases. More hikes planned for May (CMA CGM +$1000/container, Hapag-Lloyd +$500/box).
- Logistics: Indian ports working overtime; West India sailings fully booked; logistics delays due to capacity.
- US Importers: Rushing shipments to beat tariff deadline (NOW PAUSED)
- Spot Rates: Rose to $2150/FEU (up 13% on April 7).
Transpacific Shipping:
- Rates Down: Spot rates fallen for 9 straight weeks.
- Capacity Reduction: Carriers like MSC canceling sailings (at least 6 in April). Others expected to follow.
- Disruptions: Vessel changes and delays ongoing, expected through April.
Asia/EU Shipping:
- Ocean Alliance: Resumed AET service (Shanghai to Europe).
- Red Sea Risks: Renewed US airstrikes increase Houthi attack threat on ships, destabilizing region. Many targeted ships have no clear US/UK/Israel ties.
