
Week 31 Update – How the USA/European Union trade deal will affect airfreight in key markets, with focus on steel and construction material(s). Added bonus –capacity data from the Far East for US importers of retail, equipment NOI, etc.
USA – EUROPEAN UNION TARIFF AGREEMENT:

The Deal in a Nutshell:
- 15% Baseline Tariff: Most EU exports to the US will now face a 15% tariff. This is a significant change from previous rates.
- Steel Tariffs Remain High: Of note, steel exports from the EU to the US will still be taxed at a hefty 50%. This is a major point of contention and concern.
- Cars See a Drop: Car imports from the EU to the US will now be taxed at 15%, down from 27.5%.
- EU Commitments: The EU has agreed to purchase $750 billion in US energy over three years and invest an additional $600 billion in the US.
- US Exports to EU: US exports to the EU, including cars, will be duty-free, a significant win for US exporters.
- Effective Date: The new US tariffs apply from Friday. Further negotiations on specific sectoral tariffs (like steel, wine, spirits) are ongoing and could take weeks or months.
Who Wins and Loses?
- Donald Trump: Many see this as an “asymmetrical deal” heavily favoring the US due to the 15% tariffs on most EU exports, large energy purchases by the EU, and the end of a long-standing WTO agreement for zero-tariff pharmaceuticals.
- France is Not Happy: The French government has strongly criticized the deal, calling it “unequal and unbalanced” and a “dark day for the EU,” arguing that the bloc should have retaliated more forcefully. However, the European Commission has bloc-wide competency, so France cannot veto the deal.
Impact on Your Business:
Steel Sector:
The 50% tariff on steel remains a major hurdle for EU steel exporters. This will continue to impact pricing and supply chain planning for those involved in steel trade between the EU and US. European steel associations like EUROFER have expressed concerns, noting that the 15% tariff on steel-intensive products like machinery and vehicles adds further burden. The EU has reportedly lost significant steel export volume to the US since 2018 due to these tariffs.
Supporting Documents (Steel):
- EU Steel Imports & Exports: In 2024, the United States was a significant partner for EU goods exports (20.6%). The EU has historically alternated between a steel trade surplus and deficit, with a deficit in recent years. For detailed statistics on iron and steel imports from the US to the EU, you can refer to data from sources like Eurostat and Trading Economics, which show specific product categories and their import values.
- Source: European Commission – USA-EU – international trade in goods statistics (2024 data)
- Source: International Trade Administration – European Union Steel Imports Report (YTD 2019 data available, but recent trends show continued high tariffs)
- Source: Trading Economics – European Union Imports of iron and steel from United States (2024 data)
Construction Sector:
While steel is a key component, the broader construction sector will also feel the effects of the new 15% baseline tariff on many EU exports. This could mean increased costs for imported construction materials from the EU that fall under this tariff. However, it’s worth noting that many heavy construction materials (like concrete, bricks, cement) are costly to transport, so a large volume of these might not be directly impacted by the new tariffs due to limited existing trade volumes between the EU and US for such products. Certain “critical raw materials” are expected to have zero tariffs, which could benefit some construction-related imports if those materials are on the agreed-upon list.
Supporting Documents (Construction Materials):
- Overall EU-US Trade Deficit: The U.S. goods trade deficit with the European Union was $235.6 billion in 2024. This indicates a general imbalance that the tariffs aim to address.
- Source: United States Trade Representative – European Union Trade Summary (2024 data)
- Impact on Building Materials: Experts suggest that US import tariffs on EU products will likely have a minimal impact on most European building material suppliers for products like concrete, bricks, and cement, due to their weight and high transport costs. Less than 3-4% of total exports to the US for most building material categories originate from the EU.
- Source: ING Think – The worst is over for Europe’s building materials industry (2025 analysis)
- Tariff-Exempt Products: The deal includes “zero for zero tariffs” on “certain agricultural products” and “critical raw materials.” If construction-related raw materials fall into this category, it could offer some relief. The exact list of zero-rated items is still pending.
- Source: PwC Ireland – EU-US Trade Deal: 15% Tariffs Agreed, Impact on Irish Business (July 2025 analysis)
Air Cargo Capacity: A Global Snapshot for NVOCCs

For NVOCCs like ARC Global who work in EU-USA/USA-EU trade, and particularly for businesses in the steel and construction sectors, understanding air cargo capacity trends is crucial. The provided image from Let’s Rotate, showing Total Air Cargo Capacity Growth (ATK) from July 21-27, 2025, compared to the same period in 2024, offers valuable insights:
Key Takeaways from the Map:
- Global Capacity Growth: Overall, global air cargo capacity has grown by a healthy 7% year-on-year. This indicates a general increase in available space for air freight.
- Strong Transatlantic Growth:
- Europe to North America (Transatlantic Westbound): Shows an impressive 18% growth in ATK. This is excellent news for EU-USA traders, as it suggests more capacity is available for exports from Europe to North America.
- North America to Europe (Transatlantic Eastbound): Also sees significant growth at 15%. This bodes well for USA-EU trade, indicating increased capacity for goods moving from the US to Europe.
- Interpretation: These strong transatlantic figures suggest that despite tariff discussions, airlines are adding significant capacity to these key trade lanes, likely in response to broader demand or a desire to capitalize on trade flows.
- Robust Asia-Europe and Asia-North America Links:
- Asia to Europe: Capacity growth of 16%.
- Asia to North America: Capacity growth of 15%.
- Interpretation: While the primary focus is EU-USA today, the strong growth on these routes is relevant. It suggests robust demand for goods originating in Asia, which could indirectly impact capacity availability on other lanes if carriers reallocate resources. It also highlights the continued importance of Asia in global supply chains, often feeding into transatlantic movements.
- Intra-Region Growth:
- Intra-Europe: 2% growth.
- Intra-North America: 15% growth.
- Intra-Asia Pacific: 7% growth.
- Interpretation: Intra-regional growth indicates strong domestic or continental demand, which can also influence the overall availability and pricing of international air cargo. The significant intra-North America growth suggests a healthy internal market within the US and Canada.
What This Means for Steel & Construction Businesses:
- Improved Air Freight Options: The substantial capacity growth on transatlantic routes (18% EU to US, 15% US to EU) is generally positive. It means there should be more space available for urgent or high-value shipments of steel components, specialized construction equipment, or time-sensitive materials.
- Potential for Competitive Pricing: Increased capacity can lead to more competitive pricing for air freight, which could be beneficial for clients looking to manage logistics costs, especially given the existing tariffs on steel.
- Strategic Planning: While bulk steel and heavy construction materials are typically moved via ocean freight, air cargo is vital for prototypes, critical spare parts, emergency shipments, or high-value components. This capacity growth provides more flexibility for such needs.
- Consider Origin/Destination Specifics:
- For EU steel exports facing a 50% tariff to the US, the increased transatlantic capacity won’t negate the tariff’s impact, but it does offer more options for urgent shipments if the economics still make sense.
- For construction equipment or specialized materials from the US to the EU, the 15% capacity growth is good news, especially as US exports to the EU (including cars) are now duty-free.
Connecting with Previous Information:
- The increased capacity provides a counterpoint to the earlier discussion about “no tariff surge” in air cargo from Southeast Asia. While the surge wasn’t seen then, the current capacity growth suggests that airlines are anticipating and accommodating robust demand across key lanes, regardless of immediate tariff-driven rushes. This could indicate a more sustained, underlying growth in air freight volumes.
- The overall 7% global capacity growth reinforces the idea that air cargo remains a critical and expanding mode of transport for international trade.
In Summary: The latest air cargo capacity data paints a positive picture for NVOCCs operating on transatlantic routes. While tariffs continue to influence trade flows, the significant increase in air freight capacity offers more flexibility and potentially better rates for those in the steel and construction sectors when air transport is required.
Air Cargo Update: No Tariff Surge from Southeast Asia to US
For our NVOCC clients, especially those involved in the steel and construction sectors, here’s a quick look at recent air cargo trends between Southeast Asia and the US:
The Latest:
- No Tariff Rush: Despite a looming August 1st US tariffs deadline, there’s no sign of a widespread surge in air cargo tonnages from Southeast Asia to the US due to shippers rushing to beat the tariffs.
- Rebound, Not Surge: The recent increase in air cargo volumes from Southeast Asia to the US is actually a rebound from a significant drop in the previous week, according to WorldACD Market Data. It’s not a pre-tariff spike.
- Southeast Asian Gains: In the week of July 14-20 (week 29), countries like Indonesia (+52% WoW), Thailand (+18% WoW), Malaysia (+13% WoW), and Vietnam (+10% WoW) saw strong week-on-week increases in tonnage to the US, recovering lost volumes.
- Asia-Pacific Overall Up: These gains, along with a 9% WoW rebound from Japan, offset a slight decline from China and Hong Kong, pushing overall Asia-Pacific to US tonnages up by 3% WoW.
- Global Softening: Across the globe, air cargo tonnages generally softened in the third week of July, with a 2% WoW dip worldwide.
Why This Matters for You:
- No Immediate Panic: This data suggests that the August 1st tariffs, while significant, haven’t triggered a last-minute scramble to get goods into the US via air freight from Southeast Asia. This could mean a more stable, albeit potentially altered, flow of goods in the short term.
- Supply Chain Diversification: This trend aligns with a broader industry shift where companies are increasingly diversifying their supply chains away from China to Southeast Asian nations like Vietnam, Thailand, and Malaysia to mitigate tariff risks. This “China-plus-one” strategy means more air cargo traffic originating from these countries.
Supporting Documents (General Air Cargo & Supply Chain Diversification):
- Trade Pattern Shifts: Reports indicate that concerns over tariffs and trade wars have accelerated the movement of air cargo traffic from China to Southeast Asia, with countries like Vietnam, Cambodia, and Thailand seeing increased US import traffic. Airlines like FedEx have even launched direct flights from Singapore to Anchorage to meet this growing demand.
- Source: Aviation Week Network – Trade Pattern Shifts May Mean Big Cargo Growth for Southeast Asia (July 2025)
- Transshipment Crackdown: US tariffs are also being aimed at preventing Chinese firms from rerouting exports through Southeast Asian nations to avoid higher trade taxes. This could lead to increased scrutiny and complexity for NVOCCs handling goods from the region.
- Source: Al Jazeera – US cracks down on transshipment in Southeast Asia to curb China tariff evasion (July 2025)
- Shifting Sourcing: The “China-plus-one” strategy is boosting intra-Asia trade as components are increasingly sourced from China and then transferred to Taiwan and Southeast Asia for final production before being shipped to the US.
- Source: Shipco Transport Media – Taiwan, Southeast Asia See Air Cargo Surge (June 2025)
Advice:
- Monitor Tariff Specifics: While the overall air cargo market isn’t seeing a pre-tariff surge, individual product categories will still be impacted by the new tariff rates. Monitor the specific tariffs relevant to your goods, and ask me how!
- Leverage Diversification: For those looking to optimize their supply chains, I encourage continued exploration of sourcing and manufacturing opportunities in Southeast Asia to potentially mitigate future tariff impacts.
BONUS: The Big Picture: FE-WCNA & FE-ECNA
‘FE’ being ‘Far East,’ ‘WCNA’ being West Coast North America,’ and ‘ECNA’ being ‘East Coast North America.’
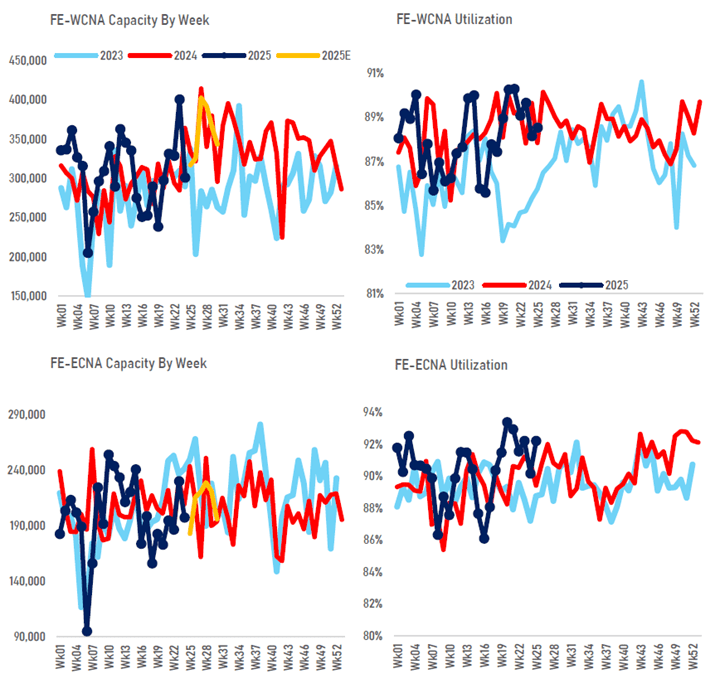
These charts break down what’s happening on the Far East to West Coast North America (FE-WCNA) and Far East to East Coast North America (FE-ECNA) lanes. Essentially, they tell us how much space is available on ships and how full those ships are.
FE-WCNA: The West Coast Story
- Capacity (Top Left Chart):
- 2023 (Light Blue): This was a wild ride, with capacity fluctuating quite a bit.
- 2024 (Red): We’ve seen consistently higher capacity than 2023 for most of the year. This is good news for shippers, generally meaning more options.
- 2025 (Dark Blue): So far, early 2025 (up to Week 28) shows capacity levels broadly similar to 2024, with some dips and peaks.
- The “Yellow Zone” (2025E): This is where it gets interesting! The projection for late 2025 (from Week 28 onwards) shows a significant drop in projected capacity compared to 2024. This is a flashing yellow light!
- Utilization (Top Right Chart):
- High & Tight! Across 2023, 2024, and 2025, utilization on the WCNA lane has been consistently high, often hovering around or above 87%. This indicates vessels are running very full.
- What This Means: Even with higher capacity in 2024, ships are still nearly packed. If capacity drops in late 2025 as projected, those utilization numbers are going to skyrocket!
FE-ECNA: The East Coast Angle
- Capacity (Bottom Left Chart):
- Similar Trend to WCNA: We see a similar pattern here, with 2024 capacity generally above 2023.
- 2025 (Dark Blue): Early 2025 capacity is somewhat aligned with 2024, but the projected late 2025 (Yellow Zone) also shows a notable drop compared to 2024.
- Utilization (Bottom Right Chart):
- Even Tighter! East Coast utilization has been consistently higher than the West Coast, often pushing into the 90-93% range. This lane is usually more constrained.
- A Warning for Late 2025: If capacity decreases as predicted, expect utilization to hit near-peak levels, making it extremely challenging to secure space.
Impact on Eastbound T/P FCL Trends: Get Ready!
This data paints a clear picture for FCL shipments moving from Asia to North America:
- Late 2025 – Brace Yourselves! The most critical takeaway is the projected reduction in capacity for both WCNA and ECNA lanes starting around Week 28 in late 2025. This is a red flag for potential supply chain disruptions.
- Rate Pressure UP! Lower capacity combined with consistently high utilization (or even higher utilization if projections hold true) means one thing: rising freight rates. Carriers will have more leverage to increase pricing due to tighter supply.
- Space Will Be King: Securing FCL space is going to become even more competitive. Shippers who don’t plan ahead will find themselves scrambling and paying premium rates.
- Premium Services & Alliances: Expect a stronger push for premium services and long-term contracts as shippers try to guarantee space. Carrier alliances will continue to dictate significant chunks of capacity.
- Forecasting is Crucial: For shippers, accurate forecasting of your needs will be paramount. Share your forecasts with your forwarder as early as possible.
- Diversify & Flex: If you have the flexibility, consider diversifying your port strategy. Can you shift some cargo if one coast becomes too constrained?
- Consider Your Inventory: The potential for delays and higher costs means re-evaluating inventory strategies. Just-in-time could become just-in-trouble if you’re not careful.
Your Forwarder’s Advice:
Start planning for late 2025 now. Talk to you me about your anticipated volumes, discuss contract options, and explore strategies to mitigate potential rate hikes and space constraints. Proactive planning is your best defense in a tightening market!
